
![]()
| |
|
|
|
|
Intusoft
Newsletter Issue #50, September 1997
Copyright
©2002 Intusoft, All Rights Reserved
| In This Issue | |||
|
2 5 9 14 16 |
18 20 22 23 |
||
Intusoft has released a revolutionary new simulation-based tool for analog and mixed-signal Failure Mode and Effects Analysis (FMEA) and Test Program Software (TPS) development called Test Designer ™. Simply put, Test Designer automates failure analysis, fault diagnostics and isolation, and generates detailed fault trees and test strategy reports. The user can easily pair...
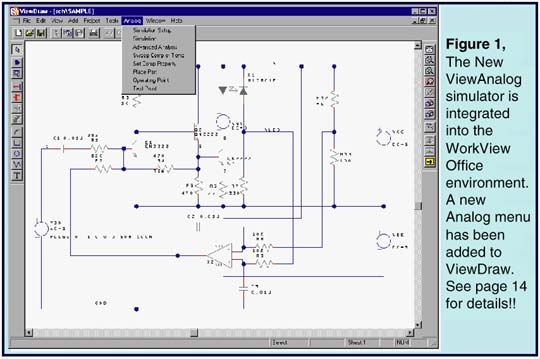
VIEWLOGIC TO OEM INTUSOFT'S TECHNOLOGY
Viewlogic Systems, Inc. (NASDAQ: VIEW) has introduced ViewAnalog™, an analog and mixed-signal simulator developed by Intusoft, Inc. The simulator is available as part of Viewlogic’s WorkView Office™ Version 7.4 suite of Windows EDA tools. ViewAnalog, which targets the design and development of analog and mixed-signal circuits, is tightly integrated with Viewlogic’s ViewDraw schematic capture tool. ViewAnalog is sold exclusively by Viewlogic as an OEM product. A similar product, called ICAP™ for Viewlogic, is available directly from Intusoft. However, the Intusoft version does not support Viewlogic’s powerful Fusion technology for mixed-mode simulation...Continued
|
A long-standing problem in electrical and mechanical circuit design has been the conflict between the needs of the designer and the needs of production and manufacturing. The main method of conveying the designer’s creation is the circuit schematic which is used to describe the behavior of the circuit as well as the details of how production will build the hardware.
The designer is concerned with creating a circuit that meets specifications. This is done chiefly through the use of various EDA tools, but mainly with circuit simulation. The designer must build multiple test configurations, add parasitic components and stimuli, and even include system elements in the simulation. A top-down design methodology, where different levels of abstraction are inserted for different components, is commonplace. Modeling electrical behavior often results in different representations for different test configurations. In general, the schematic becomes so cluttered with circuitry and data, that it must be redrawnfor production, greatly raising the probability of a transcription error.
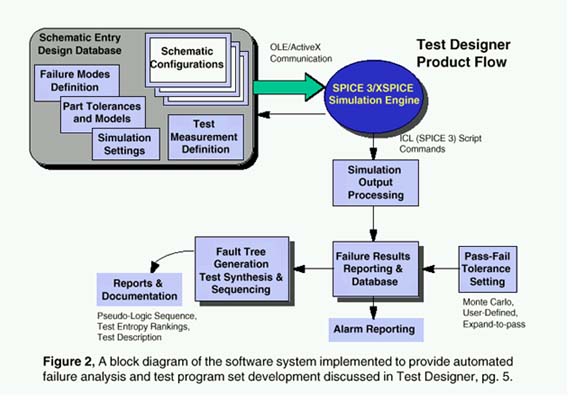
The need for a reconfigurable schematic capability becomes even more mandatory when we analyze the needs of the failure analysis and test program development software (Figure 2). In order to be effective, the simulation process can not become burdened with the bookkeeping intricacies of multiple schematic variations and analysis specifications. The designer must have a way to connect various stimuli and loads to core circuitry and to group different SPICE analyses and test measurements with each schematic configuration.
Until now, the best approach has been to hide these special configurations in subcircuits; for example a resistor’s parasitic capacitance could be included in a subcircuit. While this approach works for hierarchical schematic entry and extending individual component models, it does not solve the problem of adding test equipment, different stimulus inputs, or dealing with multiple simulation scenarios.
A hardware test setup provides loads, voltage and current stimuli and instrumentation connections at specific points on the Unit Under Test (UUT). When viewed in a broader context, the combination of the test setup circuitry
|
and the UUT can be considered to be a circuit configuration in and of itself. Indeed, for simulation purposes, the test setup circuitry must be included as part of the circuit. Most Test Program Sets (TPSs) implement multiple setups during the testing sequence. This increases the simulation burden by requiring a separate schematic for every test setup. The system described by Figures 2 and 3 addresses the multiple test setup problem with a unique solution.
|
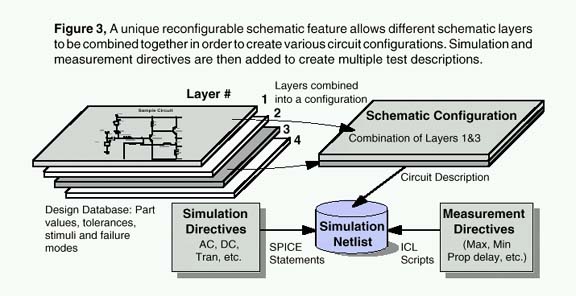
The setup/UUT combination is called a "circuit configura-tion". Every circuit configuration is composed of one or more schematic layers. A layer can be thought of as a transparency that overlays other transparencies such that as you view them, you see the completed schematic (Figure 4). Circuit nodes on the top layer connect with nodes on underlying layers as if the drawing were created on a single page. The schematic allows mixing and matching of layers to form the required circuit configurations. Any circuitry, elements, or documentation can be placed on any layer.
The user can assign each circuit configuration a name and a set of measurements. This pairing is referred to as a "test configuration". This methodology allows all of the different test configurations to be simulated in one batch operation. Use of a layered concept in itself is not unique. It is generally used as a drawing management feature to remove com-plexity from the user’s visual field, rather than making a multiplicity of configurations. While PCB layout tools have had a similar feature for some time, a configurable schematic has not been implemented (to the best of our knowledge). This is the first known graphical method which can solve the Test - Simulation bridge using a reconfigurable layered schematic approach.
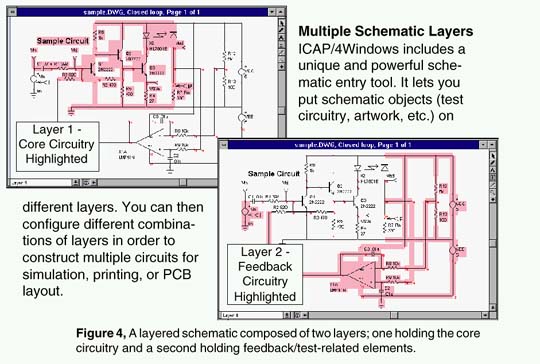
Multiple Schematic Layers
ICAP/4Windows includes
a unique and powerful sche-matic entry tool. It lets you put schematic
objects (test circuitry, artwork, etc.) on different layers. You
can then configure different combinations of layers in order to
construct multiple circuits for simulation, printing, or PCB layout.
|
NEW TEST DESIGNER...(Continued)
multiple circuit configurations with various analyses and automated measurements to create "tests". The tests are simulated for each and every part failure mode. Test Designer then grades the performance of each test against pass/fail limits. Using the results, Test Designer then automatically sequences the tests into a fault tree.
Unique Features Redefine How The Test Engineer Works Test Designer includes a fully integrated schematic entry tool, extensive model libraries, state-of-the-art SPICE3 based analog and mixed signal simulator, a graphical data post processor, and a host of features that handle the failure analysis, test synthesis and reporting. All key data entry, analysis, and reporting features are graphically driven. You do not have to write any scripts or do any programming in order to define a model, a fault, a measurement, or a test.
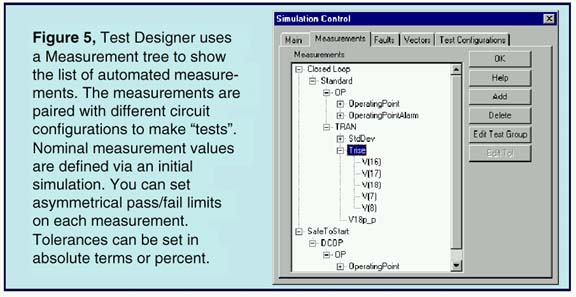
The schematic entry tool integrates all of the relevant design and test information, fault analysis results, and test sequence data. You do not have to use several different programs from different EDA vendors. A single schematic database holds multiple circuit configurations, multiple test setups, the fault properties for each part (including both topological and parametric value variations), the test definitions, the measurement definitions (Figure 5), tolerances, and all results.
Part faults are defined in a graphical manner using simple dialog entries. The proper netlist for each failed part scenario is generated automatically. You do not have to "code" any fault behavior. Over 10,000 part models are provided, and most include pre-defined failure modes. For example, all passive and active components use the U.S. Navy’s CASS "standard" for the default failure modes.
Test Designer features an automated failure mode simulation capability. This allows you to easily define and simulate a series of component faults or other out-of-tolerance conditions. Test Designer automatically inserts each failure mode without altering the appearance of the schematic, performs the analysis, and removes the fault. The process is repeated, without user-intervention, until all of the faults have been inserted and simulated.
|
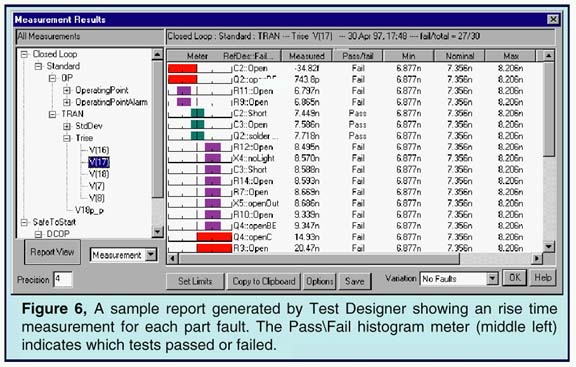
Test measurements from each simulation are setup with Measurement Wizards, while special reconfigurable report forms are used to review different views of the fault analysis and fault grouping data. Measurements such as peak-peak, maximum, rise time, propagation delay, etc., can easily be made.
An easy-to-read histogram meter shows the state of each resultant measurement, its pass/fail status, and indicates the degree that failed measurements are out-of-tolerance. Numerical results and test limits are also shown. Each measurement can be folded out to show the results for all faults (Fig. 6).
|
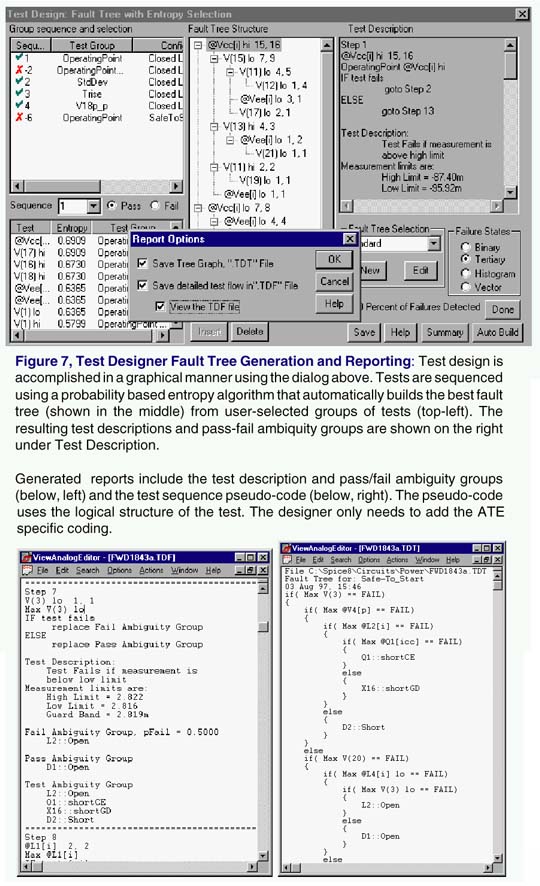
With all of the failure data in hand, Test Designer can sequence a fault tree, generate test strategy reports, and output test sequence pseudo-code (ATE independent), allowing you to quickly develop a test strategy for automated testing.
TPS design is accomplished graphically, by either automati-cally or manually selecting fault tree nodes from an ordered list of tests which are sorted by "entropy". The results for each fault tree design are saved with user names and descriptions. A fault tree can be designed all at once or in steps that gradually add more complex tests. The user can look at the results for each fault tree node, examine the underlying tests, and modify the test strategy (See Figure 7, next page).
You can enable or disable specific test vectors and part fault modes. This allows you to explore different test outcomes without having to repeat the circuit simulations.
Test results are output in several formats that can be imported in to the designer’s ATE test programming language. These files contain the logical structure of the tests. The designer only needs to add the test equipment specific coding.
The combination of automated failure simulation and test sequencing is truly revolutionary. The time-savings over manual methods is DRAMATIC. This powerful capability ex-tends SPICE well beyond its current single simulation-oriented boundaries, and provides a framework for automatic test program set design and FMEA.
With Test Designer, test strategies can be improved and de-bugged by enabling virtual production studies without the need to build a prototype or even wait until the design process has been completed.
|
Test
Designer™ is a vast improvement over current manual test
development practices, and dramatically reduces the time consuming process of test software development. |
A detailed brochure on Test Designer, several technical articles and a demonstration version are available on the Intusoft web site. Test Designer is available immediately. It requires Windows 95 or Windows NT. Required product maintenance is 15% of the purchase price. Training classes are also available.
|
Christophe BASSO, consultant, SINARD, FRANCE
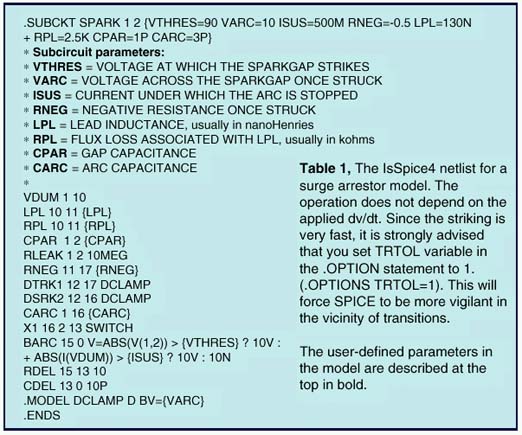
Spark gaps or Electrical Surge Arrestors (ESAs) are highly nonlinear devices whose function is to stop transient surges on DC or AC power-supply lines. Such transients can be caused by lightning strikes, motor starts, etc. In other cases, spark gaps can also be used repetitively in ignition-type circuits. A spark gap is made of two electrodes that face each other across a short distance. The gap is fill with air or an inert gas like argon or neon. If the voltage applied to the ESA is below its striking voltage (or avalanche potential), the current flowing through the ESA is close to zero. Once the striking voltage is attained, the voltage across the ESA suddenly collapses to a value called the glow voltage. If the current still increases, the ESA voltage decreases further to a level called the arc voltage, where it stays until the surge passes. At this point, the ESA stays conductive until its current falls below a sustaining value in a manner similar to a thyristor.
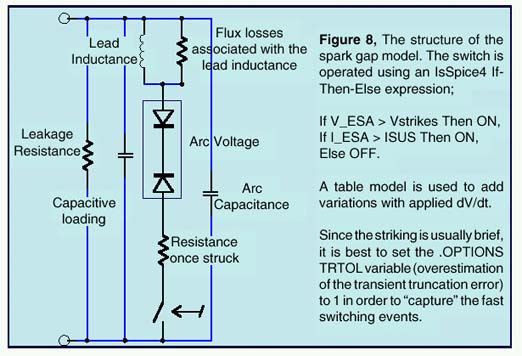
Modeling such a component with SPICE can be done in several ways [1, 2]. For the sake of efficiency, we have used a macro-modeling technique. It consists of assembling SPICE primitives in a group to describe a complex electrical function. Figure 8 depicts the general ESA model we have adopted.
|
In the OFF state, the voltage-controlled switch is open and only a leakage current circulates in the ESA. The switch stays OFF until the voltage across the ESA rises up to the striking voltage. At this point, the switch is immediately driven ON and the network made of the back-to-back zener diodes and the series resistance is applied across the ESA terminals. At this point, the voltage collapses to the arc value and the current starts to rise. When the surge passes, the ESA current decays until the sustaining value is reached and the switch opens. In the first model in Table 1, the glow transition is not taken into account, and neither is the dV/dt applied to the ESA. The netlist uses standard SPICE3 elements combined with an IsSpice4 If-Then-Else behavioral element (BARC, in Table 1 below) which performs the arcing action.
|
In the second model, shown in Table 2, a behavioral piecewise linear (PWL) table function is used to account for the dV/dt applied to the device. The PWL table converts the absolute value of the applied slope in coefficients that, when multiplied by VTHRES, will increase the final BARC level. The PWL values in the PWL_001 model are extracted from a curve which depicts the ignition voltage versus the applied dV/dt. The curve generally appears parabolic when the x axis uses a log scaling. The effect is modeled by the source BARC 15 0 V=ABS(V(1,2)) > {VTHRES} + {VTHRES} * V(33) ?... V(33) increases VTHRES by a ratio defined by the manufacturer’s curves.
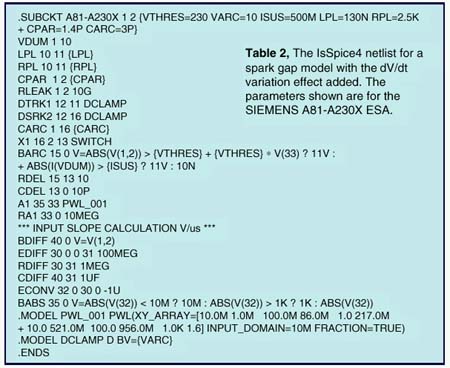
|
Obtaining the PWL points is easy. For the Siemens A81-A230x, the threshold voltage of the spark gap is 230V. The curve is flat up to 10kV/s or 10mV/us. For shallow slopes, up to 10mV/us, the first coefficient will be very low, between 1mV and zero. The third point on the curve is for 10E6V/s or 1V/us. At this point, the threshold voltage is 280V. The coefficient is simply: ABS(230-280)/230=0.217, or in the PWL table format: 1.0, 217M. For 10E7V/s or 10V/us, the curve gives a threshold of 350V: ABS(230-350/230)=521M —> 10, 521M and so on. To adapt the model to a particular spark gap device, you only need to enter a few parameters (variables in curly braces) found in the manufacturer’s technical specifications.
|
|
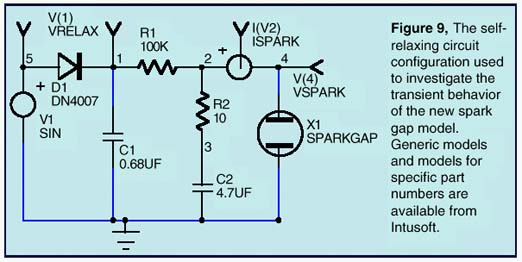
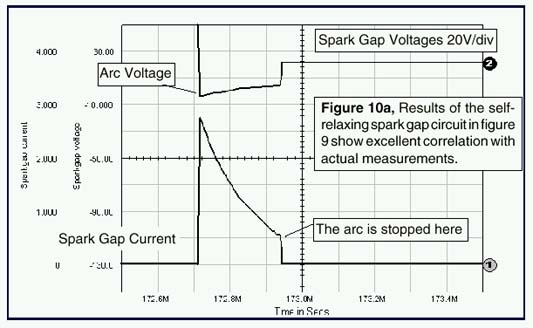
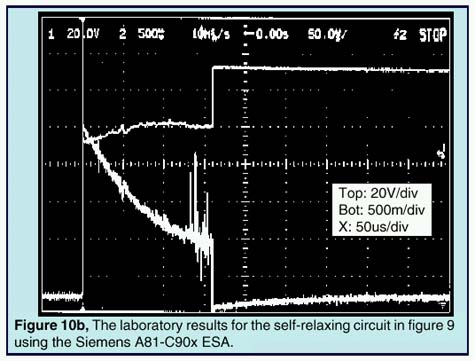
The first IsSpice4 test is made using a self-relaxing configura-tion as depicted by Figure 9. Since the phenomena are very fast, you will need to view the raw non-interpolated SPICE data (internal calculated data points) simulated by IsSpice4 and not the interpolated (.PRINT) data specified by the TSTEP parameter in the .TRAN statement. Thanks to IntuScope, ICAP’s waveform analysis tool, you can easily explore both types of data. Figure 10a depicts the results given by IsSpice4. Figure 10b shows an oscilloscope hard-copy of the actual tested circuit.
|
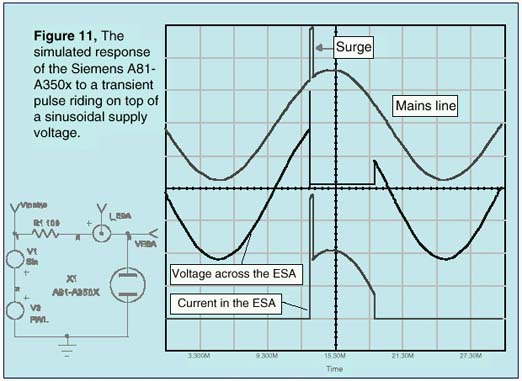
A second test is run using the spark gap as a real surge arrestor. The power mains supply a device protected by an ESA. A 1ms transient (PWL source: PWL 0 0 13ms 0 13.001m 600 13.3ms 600 13.301m 0) has been added to the sinusoidal (SIN 0 320 50) supply voltage in order to trigger the ESA. The results simulated by IsSpice4 are shown on Figure 11.
|
The model presented here runs fast and converges without difficulties. Although the model accounts for several nonlinear effects, it is still a simplification of the complex phenomenon associated with spark gap ignition and arcing.
Note that a warm or cold cathode fluorescent (CCFL/HCFL) lamp could be easily derived from this model. In the next Intusoft Newsletter we will explore such a model and give examples.
A pre-made set of surge arrestor models for various manufacturer’s devices is available as part of the new Mechatronics model library. The library will be available November 3, 1997. More details on the Mechatronics library will be available in the next newsletter.
References
[1] An Electrical Surge Arrestor (ESA) Model For Electromagnetic Pulse Analysis, Rockwell International Electronics Operations, IEEE Transactions on Nuclear Science, Vol. NS-24, No 6, December 1977
[2] A SPICE model for simulating Arc Discharge load, M. NARUI, 1991 IEEE Industry Applications Society Annual Meeting, Volume II.
VIEWLOGIC TO OEM INTUSOFTS TECHNOLOGY - New ICAP for Viewlogic
(Continued)
Dave Orecchio, Director of Marketing for Viewlogic’s Systems Group, stated "After reviewing their (Intusoft’s) technology for analysis of analog designs, Viewlogic selected Intusoft for the ViewAnalog product. The technical expertise of Intusoft, coupled with customer demand for strong technology in ViewAnalog, convinced us that a strategic relationship and OEM agreement with Intusoft would benefit the broad range of both companies’ customers."
"We are excited about this new agreement," said Charles Hymowitz, Vice President of Intusoft. "With Viewlogic, we can reach a whole new market with our state-of-the-art software. Both Viewlogic and Intusoft are using OLE/ActiveX technology to create a previously unattainable level of integration. Viewlogic customers will now have the easiest-to-use, most sophisticated analog/mixed-signal simulation environment; one which is far superior to previous offerings".
|
In addition to its native analog and gate-level digital simulation capabilities, ViewAnalog supports the BSIM3 version 3 and SOI MOSFET models. The tool also supports SPICE libraries with over 10,000 analog and digital parts, as well as C-code subroutine modeling, RF device models and a unique power supply designer’s library.
The interactive operation of ViewAnalog frees the ViewDraw user from traditional batch-style SPICE analysis. In addition, SPICE part browsing and model editing allows easy design entry along with interactive cross-probing of the schematic. High-performance algorithms provide very fast simulation and improved convergence for difficult circuits. ViewAnalog’s advanced features include: behavioral modeling, sweeping of any circuit variable; native mixed mode and gate-level, 12-state timing simulation; interactive waveform cross-probing, automatic curve-family generation, and real-time display of voltages, currents and power dissipation. ViewAnalog can analyze switch-mode power supplies, mixed-signal ASICs, RF communication systems, PCB interconnects, control systems, and mixed electrical/mechanical systems.
Viewlogic Systems, Inc. is a worldwide supplier of electronic design automation software. For more company and ViewAnalog product information, see the Viewlogic internet home page at http://www.viewlogic.com. ICAP for Viewlogic will be available October 14, 1997 from Intusoft or your local dealer. Options include RF, Power, and Mechatronic (Mechanical/Hydraulic) SPICE model libraries.
The next system in the ICAP™ series has been announced; ICAP for Protel. For Protel Schematic 3™ users, the wait for seamless integration of SPICE 3 based simulation is over! ICAP uses the EDA Client/Server architecture, Protel’s power-ful integration technology and OLE (Object Linking and Embed-ding) to transparently integrate the powerful set of ICAP/4 analog and mixed signal capabilities into the Protel Schematic 3 schematic environment. ICAP for Protel will ship September 29, 1997. Contact Intusoft, your local Intusoft dealer, or your local Protel dealer for more information. There are two Deluxe options; RF and Power. They each include the SpiceMod modeling software, Vendor Supplied IC models, SPICE Reference Books (A SPICE Cookbook & SPICE Applications Hand-book), and either the RF Device or Power Supply Designer’s model library.
New ICAP/4Rx - Your Prescription For Reduced Complexity
If you’ve been looking to upgrade your evaluation version of SPICE, or are thinking about getting started with simulation, we’d like to suggest a system that’s easy-to-learn but powerful enough to tackle all of your design jobs. It’s called ICAP/4Rx and it’s a complete circuit simulation system that includes everything you need to simulate all types of system, board, and IC level designs.
The ICAP/4Rx system strikes a perfect balance between ease-of-use and power. It has the power to handle tough designs, and removes the steep learning curve associated with using SPICE. And it does this without compromising power as some other electronic workbench systems do, and at the lowest cost possible.
Simulation Environment
SPICE Features
|
ICAP/4Rx is an integrated circuit simulation system including our 5th generation schematic entry tool, proven IsSpice4 simulator, waveform post processor, and SPICE model libraries. It is reduced in complexity in order to provide you with the easiest simulation environment to use.
New Graphical User Interface
Wizards
Other Features
Benefits To New Users
Cost Difference Upgrade to ICAP/4Windows
ICAP/4Windows includes a number of key features that are not found in ICAP/4Rx. But as with ALL Intusoft software you can upgrade for the price difference.
- Native Mixed Mode simulation
- Full ICAP/4 Model Libraries (12,000+ models)
- More advanced IsSpice features (Interactive Sweeping, VB/OLE Interfaces)
- More advanced analyses (noise, distortion, sensitivity)
- Monte Carlo analysis
- Circuit Optimization
- Ability to add Design Validator™ and Test Designer™ options
- Failure Analysis
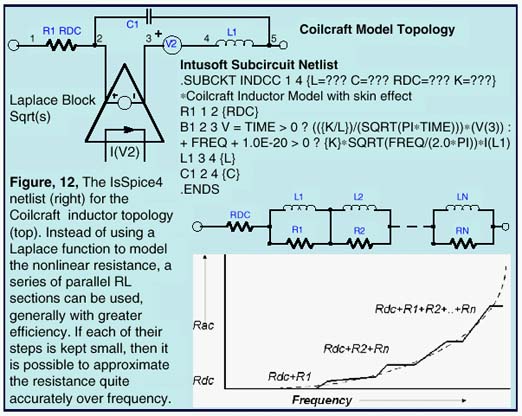
A variety of new vendor supplied models are included in this issue of the Intusoft Newsletter floppy. PWM ICs, TI, Maxim and AD Op-Amps, Polyfet RF Power Mosfet, and Zetex discretes, to name a few. Models for Coilcraft Inductors and lasers, are also included on the floppy and are discussed below in more detail.
Figure 12 shows an equivalent schematic of an inductor as described by Coilcraft (www.coilcraft.com) in their DOC158-2 app note [1]. The coilcraft topology uses the square root of s, implemented using a Laplace expression, to model the skin effect. Skin effect can also be modeled using a network of linear components [2]. For example, Magnetics Designer uses a series set of parallel RL elements as shown in Figure 12. This technique is more efficient and less prone to simulation timestep problems than the Laplace approach.
|
In any case, the IsSpice4 syntax representing the coilcraft topology is shown in Figure 12. R1 is the inductor dc resistance, B1 forms an equivalent circuit for the AC inductor resistance. The If-Then-Else expression defines a frequency dependent voltage which simulates the frequency dependent resistance due to the conductor skin effect. L1 is the low frequency inductance. This is measured at a low frequency where the distributed winding capacitance is negligible. C1 is the distributed winding capacitance. Dielectric and permeability effects are not directly accounted for in this model.
[1] Modeling Inductors with SPICE, Coilcraft, Cary, Illinois, Tel.847-639-6400
[2] "SMPS Simulation With SPICE 3", Steve Sandler, McGraw-Hill 1997.
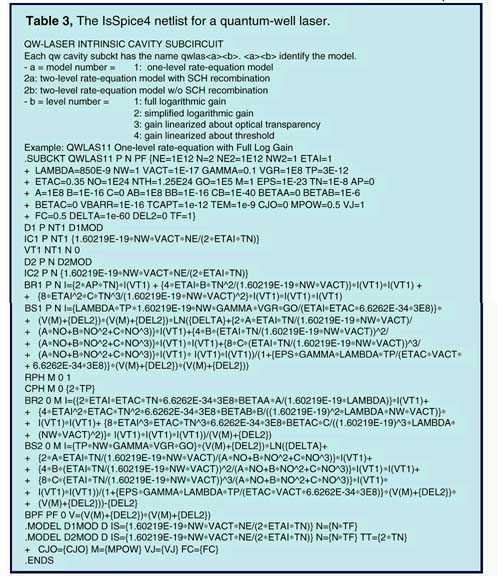
QW-Laser Model Using Rate Equations
Pablo V. Mena, Steve. A. Javro, Sung Mo Kang Copyright 1997 The Board of Trustees of the University of Illinois. All rights reserved. Reprinted with Permission from The Board of Trustees of the University of Illinois.
The quantum-well (QW) laser model is implemented as an equivalent circuit composed of both parasitic elements (series and parallel) and one of two possible intrinsic cavity models.
The first cavity model is based on the two basic rate equations, one for QW carrier concentration, the other for photon density in the active region. The second cavity model includes a third rate equation for carriers in the barrier, or confinement, layers adjoining the QWs. Unimolecular, radiative, and Auger recombination are each accounted for in the model. Furthermore, one of four different gain terms can be chosen. These terms include both logarithmic gain expressions as well as linearized ones. Finally, the parasitic elements of the model can account for series resistance, additional series diode effects, and shunting resistance or capacitance. Unlike a typical model implementation within SPICE, the laser model is included as a subcircuit. (Table 3).
[1] P. V. Mena, S. M. Kang, T. A. DeTemple, "Rate-equation-based laser models with a single solution regime," Journal of Lightwave Technology, vol. 15, no.4, pp. 717-730, April 1997
 |
Intusoft is pleased to announce the availability of an important NEW SPICE reference book. The book, entitled SMPS Simulation With SPICE3, is published by McGraw-Hill. It is authored by Steve Sandler, a well known authority in the power electronics and simulation arena. The book is a MUST HAVE for every power circuit designer who is using or thinking of using SPICE. It includes information on magnetics and power supply modeling, simulation, and circuit design techniques. There is also a chapter from renowned magnetics expert Rudy Severns on Modeling Magnetics (inductors, transformers, nonlinear core models, and reluctance modeling). Topics in the new book include:
The book is available from Intusoft or your local Intusoft dealer immediately.
Newsletters Page | Issue 54 | Issue 53 | Issue 52 | Issue 51 | Issue 50
©2002 Copyright Intusoft, All Rights Reserved