In this analysis (actual WCS.SCP file), we first run a reference simulation and make a
plot to save the results. Then a new simulation is run for each
toleranced parameter, perturbing the parameter by a fraction
of its tolerance. Then the differences between these measurements
and the reference measurements are saved. The absolute value
of the difference measurements are summed and saved in the IsSpice4
output file and in a format that can be read back into the Results
dialog in SpiceNet. This is not as rigorous as an EVA analysis
or a worst case by optimization; however, it is the most computationally
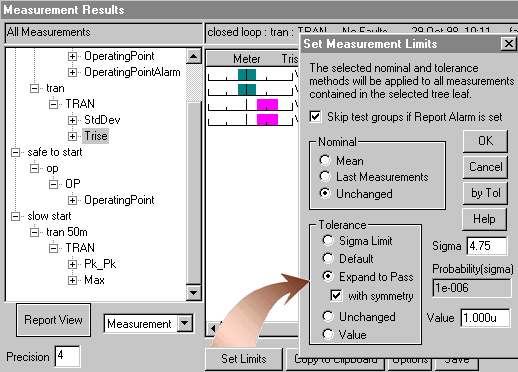
efficient method. You can set the min-max measurement test limits
by expanding the measurements to pass with symmetry in the Results
dialog; as shown below.
The WCS analysis is based on the assumption
that each measurement is a linear function of all of the parameters.
For most moderately complex circuits this assumption is invalid.
Generally you will get tolerances larger than the 3 sigma limits
of a statistical analysis, however, you should run a Monte Carlo
analysis for at least 6 cases and set tolerances based on the
Monte Carlo analysis, usually to 5 sigma, before expanding the
WCS data in order to be sure that non-linear relationships are
taken into account.