
![]()
 |
|
|
|
|
Intusoft Newsletter Issue
#58, November 1999
Copyright ©2002
Intusoft, All Rights Reserved
| In This Issue | |||
| 1 | IntuScope5 Beta is Posted on the Web | 4 | Vote for Help on the Web |
| 2 | New ICAP/4 Version 8.x.7 | 5 | ICAP/4 Software Winners |
| 3 | High Voltage Booster Amplifier | . | . |
Intusoft will release a beta version of the IntuScope5 waveform processor program at the end of this month. This beta version will be publicly available FREE of charge to any interested person via download from Intusoft’s web site.
Why is Intusoft offering IntuScope5 to anyone for FREE?
We hope to encourage more people to buy our software tools by allowing them to see first hand how easy they are to use and how powerful they are. User feedback in regards to IntuScope5 will be used to drive product improvements and new features for the final release. IntuScope5 can be used in conjunction with all Intusoft ICAP/4 products. In addition, folks who are using SPICE simulators from other vendors can use IntuScope5 to view and manipulate their simulation data; IntuScope5 reads the simulation output (.OUT) text file.
The IntuScope program has been completely redesigned from the ground up, with significant enhancements to the waveform selection, manipulation, scaling, viewing, and math operation capabilities. In addition, IntuScope5 now provides an even larger wealth of uncompromising features for the advanced user. Powerful interactive features which require communication with the SPICE simulator and the SpiceNet schematic capture program have also been enhanced.
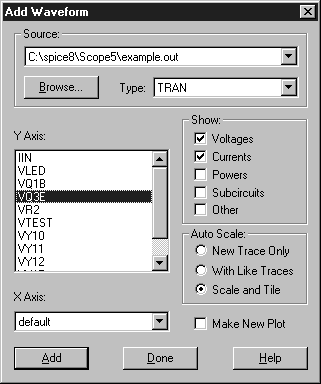
The new “Add Waveform” dialog (Figure 1) is used to select the active project. The project may be the active simulation (for ICAP/4 or Test Designer users only), or a prior simulation’s output file. Check boxes are provided so that you can globally show or hide specific waveform types within the waveform list. We’ve also added new autoscale functions so that waveforms can be automatically scaled, tiled, and/or linked as they’re added to a graph.
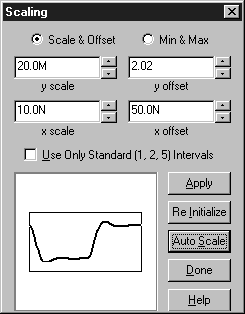
The new Scaling dialog (Figure 2) has
been enhanced to include scale/offset or min/max settings. In
addition, there is a new capability to limit the x and y axis
scaling to multiples of 1, 2, and 5, just as you would see on
a laboratory oscilloscope.
 |
 |
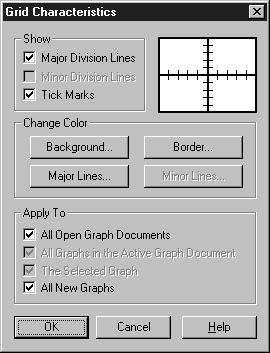 |
A new “Grid Characteristics” dialog (Figure 3) allows the user to control the grid line characteristics, line color, border color, and background color.
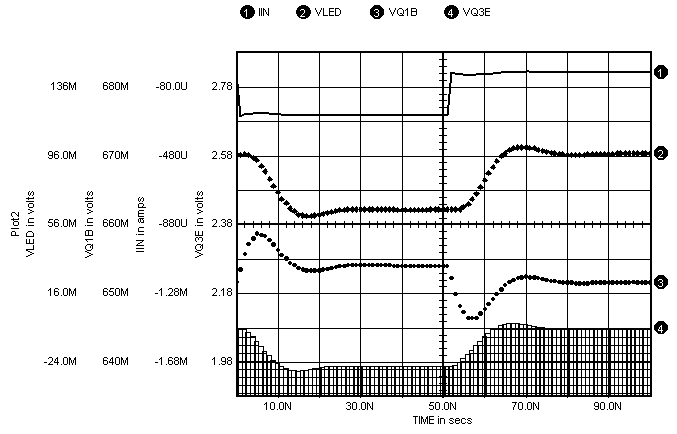
New trace style settings have been added (Figure 4), which include several line, dot, and bar styles. These features greatly enhance the ability to make great-looking presentation quality graphics (Figure 5).
 |
 |
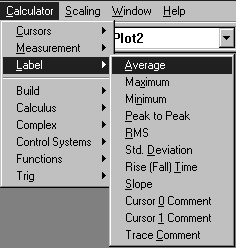 |
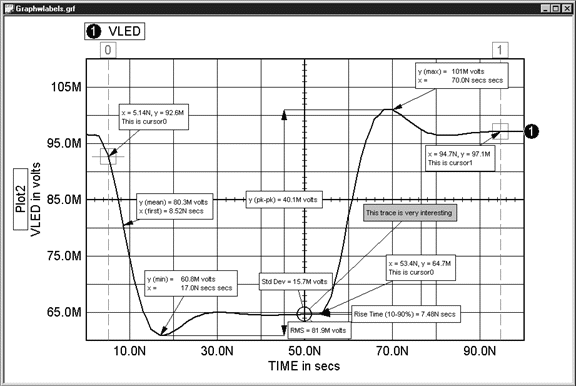
Another enhancement is in regards to waveform labels (Figure 6). Labels for the most common measurements can now be placed directly on any waveform graph (Figure 7) with a single mouse click. These labels can be individually moved, resized, and customized in regards to text font, color, and justification. The background color and border display can also be customized.
 |
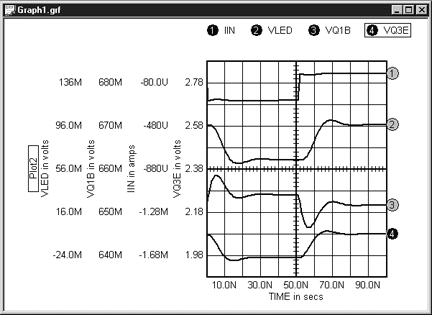
The Y-axis scaling label capability has been improved in order to permit several Y-axis labels to be displayed on a plot. The waveforms in Figure 8 were autoscaled and tiled as they were added to the graph. In this example, all four traces have the same x-axis scaling, and each of the four traces shows its y-axis scaling label.
Traces can be moved vertically or horizontally by clicking and dragging the mouse in the desired direction. Traces can also be copied and pasted from one plot to another, or dragged and dropped from one plot onto another plot.
 |
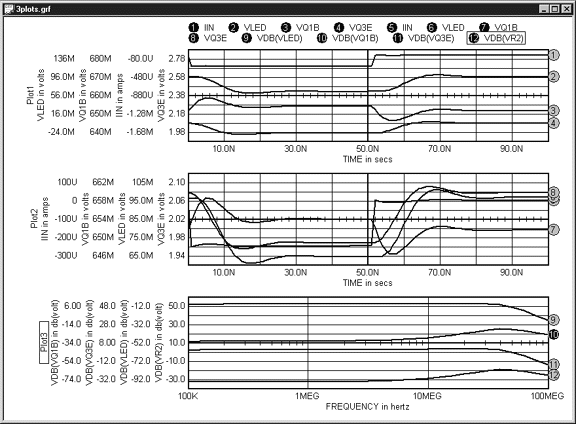
Several plots can now be displayed within a single graph window (Figure 9). You can mix and match different plot types, i.e. Tran, AC, etc. A new function has been added so that you can automatically create a new plot on-the-fly when a selected waveform is displayed.
 |
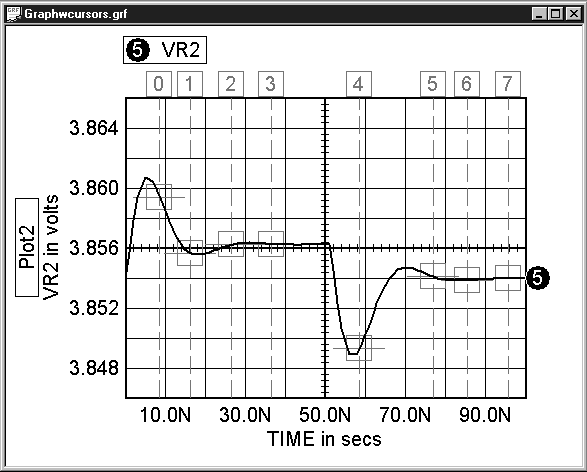
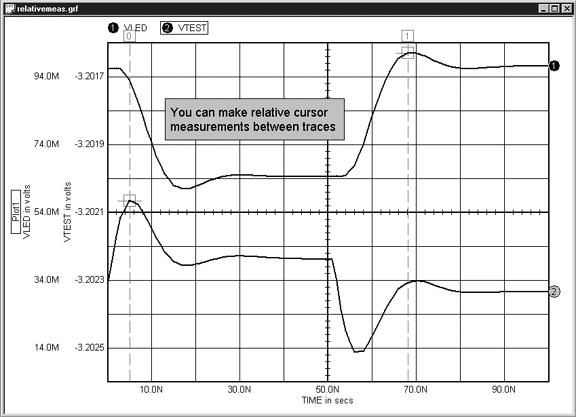
An unlimited number of cursors can be used on any plot (Figure 10), and cursors can be moved from one trace on a plot to another trace on the same plot (Figure 11). This allows the capability to make relative measurements on different traces within the same plot. In addition, if two plots have the same x-axis scaling, each trace will show dotted lines which appear on both plots as the trace is dragged, so you can now make relative measurements between different plots.
| Figure10, Example which demonstrates the new multiple cursor display capability. Each cursor's X-axis and Y-axis data is displayed in the new Cursor Bar (not shown). |
|
 |
A new scripting capability has been added. This powerful and time saving capability eliminates the need to manually repeat repetitive tasks. IntuScope5 includes several scripts which perform different types of measurements and functions. The user has complete control over the script menu names and the locations for each script; the scripts in the menus parallel the script files and folders within the installed scripts folder. Users may also create and edit their own scripts.
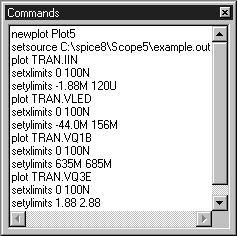 |
For example, any graph window can be saved in the form of a text script (Figure 12). That script can later be recalled and executed in order to recreate the waveform graph via a single mouse click. Scripting adds a lot of power to IntuScope5. |
We have also added an update function which allows you to display new waveform simulation data in the following ways:
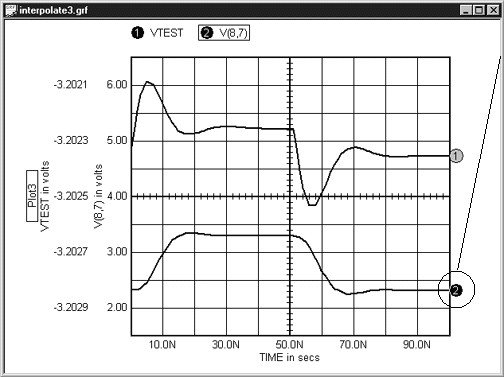
Lastly, a new automatic interpolation feature has been added so that math operations can be performed on waveforms from different simulations, even if the waveforms have different X-axis ranges and different quantities of data points. IntuScope5 automatically interpolates the data points and scales each waveform. The first displayed waveform dictates the X-axis scaling.
For example, the two waveforms shown in Figure 13 have different X-axis ranges and different quantities of data points. Waveform #1 spans from 0 to 100ns, and waveform #2 spans from 0 to 200ns.
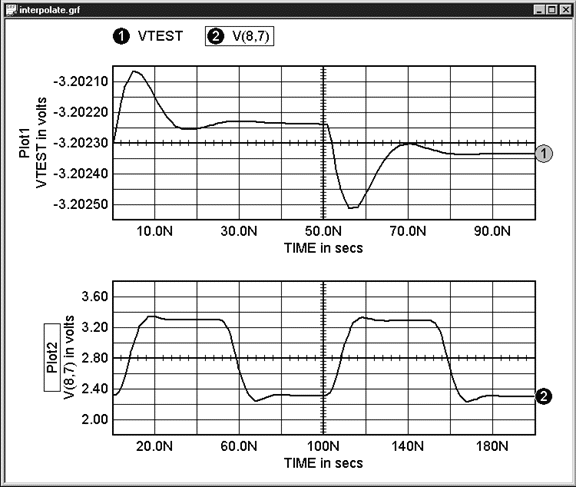 Figure 13, Two waveforms which have different
quantities of data points and different X-axis |
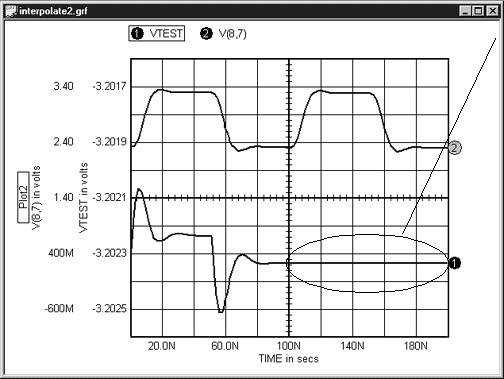 |
If waveform #1 is dragged from the upper plot to the lower plot (Figure 14), its data is auto- interpolated and extended so that it spans from 0 to 200ns. |
 |
If waveform #2 is dragged from the lower plot to the upper plot instead (Figure 15), its data is automatically interpolated and truncated so that it spans from 0 to 100ns. |
We hope that you enjoy using the IntuScope5 beta. Send us your
comments and suggestions.
BACK
TO THE TOP
Intusoft will release the ICAP/4 Version 8.x.7 in November. New purchases will include the new 8.x.7 CD. Maintenance updates will be posted on Intusoft’s technical support page, http://www.intusoft.com/support.htm. Customers who have purchased an 8.x.6 product and have a valid maintenance agreement should enter their product serial number and then download the appropriate update file.
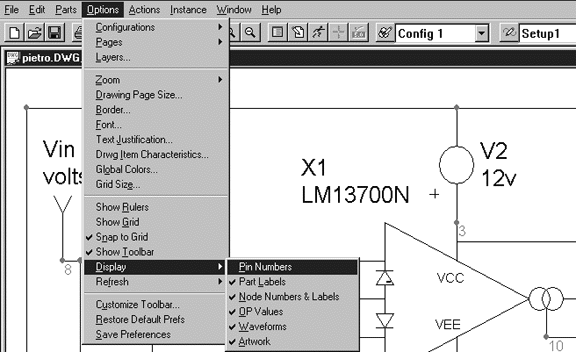
The following items highlight what will be included in the maintenance update release:
 |
|
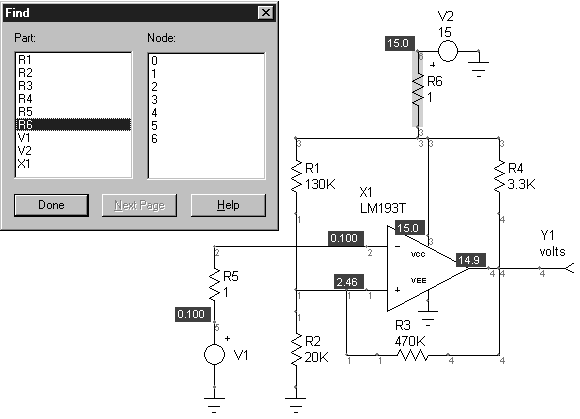
Figure 17, The new Find function provides quick and easy location of a part or node. |
|
By Karl Heinz Muller and Bill Halal
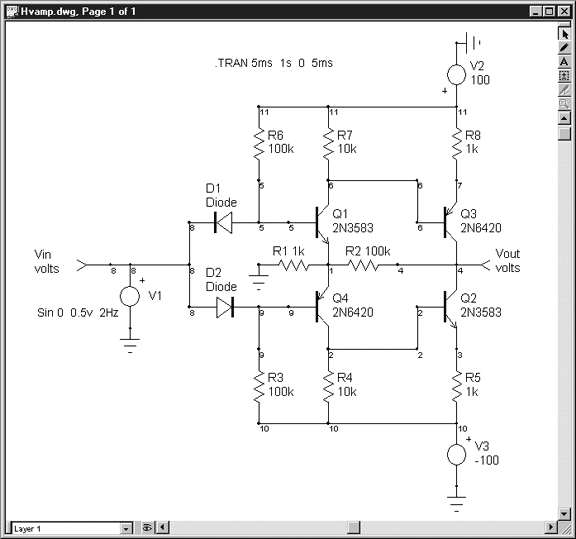
Operational amplifiers are typically capable of handling DC voltages in the range from 1.5 to 15V, and their output voltage swing cannot exceed these limits. In situations where higher output levels are desired, a voltage booster can be connected in cascade. In the following example, a dual stage complementary push-pull amplifier is shown (Figure 18). This circuit provides an output swing of +/-100V. As with any DC coupled class-B amplifier, special attention must be given for the stabilization of the operating point. Close matching of D1, D2, Q1 and Q4 is required in order to avoid excessive crossover distortion or thermal runaway, respectively. In the physical layout, D1 and D2 should be replaced with a collector-base connected transistor. Simulations have shown that the biasing scheme is stable over a wide temperature range, when these transistors are of the same type as Q1 and Q4.
 |
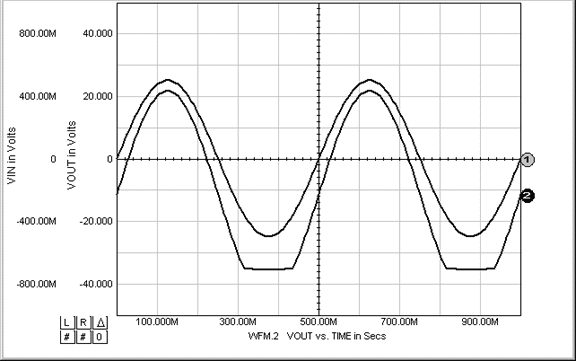
NPN transistors Q1 and Q2 have a beta value of 182. PNP transistors
Q3 and Q4, however, have a beta value of 130. When the simulation
was performed, the output waveform was asymmetrically clipped
because of the imbalance between the transistors
(Figure 19).
 |
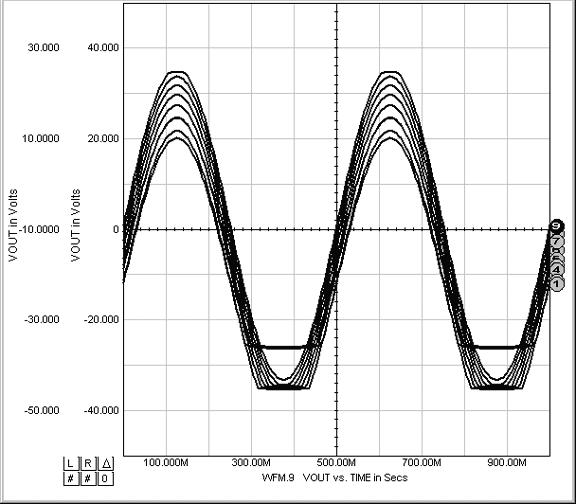
A sweep was then performed in order to study the effects due to the differences in the transistor beta values. The beta value of transistor Q3 was swept from 100 to 190 in increments of 10 (Figure 20). Notice that when its beta was 190, as represented by waveform #9, the negative half-cycle clipping distortion disappeared and maximum voltage swing was achieved.
 |
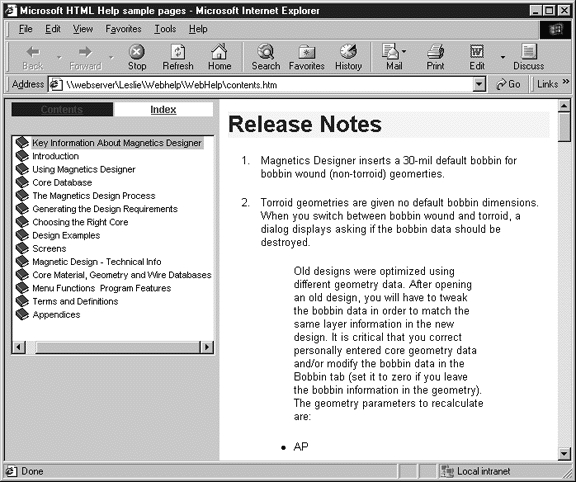
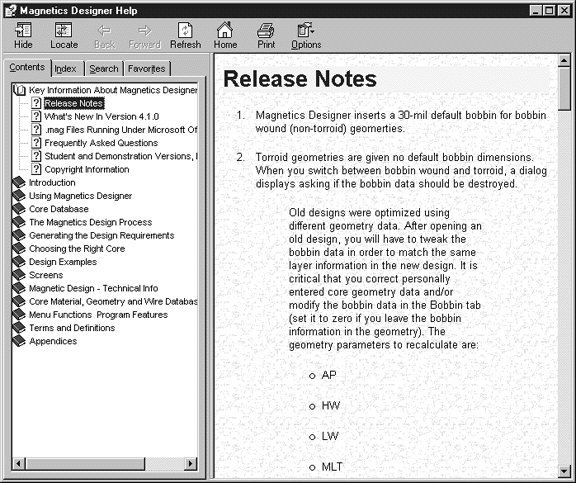
We're contemplating the creation of either Web-based Help or HTML-based
Help for all of our products. We'll post a voting area on our
web site so that visitors can let us know which format they prefer.
Here's a brief summary of the benefits and drawbacks of each format:
 |
Advantages:
Disadvantages:
 |
Advantages:
Disadvantages:
Congratulations to the lucky raffle winners who won free ICAP/4 software at Autotestcon in San Antonio, Texas in September.
Harry Jennings won a free ICAP/4 Windows software package, and Kevin Coggins won a free ICAP/4 Rx software package. Enjoy!
Copyright ©2002 Intusoft, All Rights Reserved