Simulation-Based
Test Program Synthesis Reduces Analog Test Definition Time From
6 Months to 6 Weeks
|
By Harry Dill
President, Deep Creek Technologies, Phoenix, Arizona |
| Simulation-based test program synthesis reduced the time needed
to define diagnostic tests for analog controller cards used on New York
City subway cars from 6 months to 6 weeks. It would have taken an enormous
amount of time to manually develop a sequence of 650 tests to cover a fault
universe of 1,100 failure modes for the 850 components in the controller
cards. Instead, a new simulation-based test synthesis software package was
used to largely automate the process so that the task could be completed
in only 240 hours. The test engineer involved in the project took advantage
of the software's ability to automatically generate a fault dictionary for
every node, and a rough cut of a fault tree that sequences the tests to
detect every failure mode. The ability to start at this point and simply
edit the fault tree to reliably isolate faults saved a huge amount of time.
The reliability of the resulting fault tree was substantially higher than
that which could be achieved with the manual approach, since the detailed
simulation results provided by the software gave the test engineer the opportunity
to evaluate the fault tree to a much higher level than previously possible.The project began when Instrumentation Engineering, Inc.,
Wayne, New Jersey, was contracted to develop a general-purpose diagnostics
test station to service a multitude of analog circuit boards which are used
on all cars in the New York City subway system. The firm developed a debug
station which utilizes a variety of GPIB and PC instruments, all of which
are tied to a personal computer that runs the diagnostic routines. Although
the customer is responsible for writing the majority of the test sequences,
Instrument Engineering contracted with Deep Creek Technologies to develop
the test sequence for the propulsion controller circuit board which is used
on the majority of the subway fleet. This card controls propulsion and braking
based upon inputs from the operator interface, CPU and other signals, and
was selected for development of the initial diagnostic test sequences because
its exceptional complexity made it a good candidate for proof-of-concept
testing. |
 |
|
Figure
1 - Motor Current Transducer Input Circuit
|
| The 18
final verification tests were assigned by the customer. The diagnostic test
sequences were required to isolate the cause of a failure in any of these
tests. Just one year ago, this project would have been a living nightmare.
The lack of availability of simulation-based test synthesis tools for analog
and mixed signal circuits would have made it necessary for the test designer
to manually analyze each circuit in order to determine the voltage that
would be generated at each node in response to various signals. Several
hours would have been spent analyzing each failure mode, and a considerable
amount of estimation would have been needed because there wouldn't be enough
time to thoroughly simulate every possible failure mode. Then the test engineer
would have to tabulate all calculations and predictions and then analyze
that data in order to manually develop the test strategy which is used to
code the automatic testing sequence. The development of this test strategy
would again require a considerable amount of guesswork because there wouldn't
be enough time to reevaluate the isolation characteristics of every subsidiary
branch when the detection characteristics of one or more tests were changed,
or the tests were re-sequenced. |
Automated synthesis
|
| Fortunately, last year a simulation-based synthesis tool was
developed, and it offers the ability to automate analog and mixed signal
circuit test simulation, fault analysis and fault isolation, and generates
detailed test strategy reports. Test Designer, offered by Intusoft of San
Pedro, California, includes a fully integrated schematic entry tool, extensive
model libraries, a state-of-the-art SPICE3-based analog and mixed signal
simulator and a graphical data post processor. Over 13,000 part models are
provided, and most include predefined failure modes. All key data entry,
analysis and reporting features are graphically driven, so the user doesn't
have to write any scripts or code in order to define a model, fault, measurement
or test. This software package costs $12,000 and runs on a personal computer
under Windows 95/98 or NT.The circuit was parsed into logical segments such
that no feedback loops crossed segments. It should be noted that the software
does not require segmenting or parsing of the circuit in any way. Each segment
was entered into Test Designer using the program's graphical drag and drop
schematic entry features. The program provided the component failure modes
defined in the CASS Red Team Package, and allowed the engineer to define
custom failure modes as required in a few cases. For example, the default
open resistor value of 100 megaohms was replaced with a value of 1 gigaohm
where necessary. Component tolerances are also supported for use in subsequent
Monte Carlo analyses, to assist in the definition of pass/fail limits. That
wasn't required in this application because the final verification limits
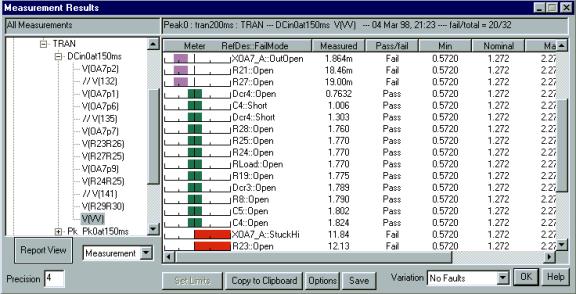
were well defined. The next step was simulating the circuit. Each go-line
test applied static DC voltages as stimuli, and used static DC voltage as
the observed output parameter. The software generated a simulated value
for every defined circuit measurement, and the results were viewed and used
to guide further refinement of the tests and their limits. |
|
|
|
Figure
2 - Example dialog showing the simulation results.
|
|
Table
1
Node voltage variations due to component parameter in tolerance variations.
|
| Measurement
Node |
Mean Voltage |
3 Sigma
Voltage |
| 131 |
11.08 uV |
82.17 nV |
| 132 |
-409.9 nV |
18.97 nV |
| 133 |
-38.01 mV |
12.55 mV |
| 134 |
19.45 uV |
3.180 uV |
| 135 |
-230.8 nV |
10.53 nV |
| 136 |
-1.913 V |
0.1926 V |
| 137 |
-1.895 V |
0.1890 V |
| 138 |
115.1 uV |
264.6 uV |
| 139 |
-6.295 uV |
2.246 uV |
| 140 |
-18.99 mV |
6.169 mV |
| 141 |
-229.9 nV |
9.336 nV |
| 142 |
1.926 V |
0.2546 V |
| MotorCurrentIn |
1.902 mV |
595.8 uV |
| TP2 |
3.853 V |
0.5098 V |
|
| Setting limits |
| Initial
test limits were defined very rapidly for all nodes by selecting a global
set of +1 volt. The Test Designer software package then developed
a fault dictionary that identified every failure mode that could cause each
test to fail. At many nodes, diagnostic test limits were refined by noting
the output parameters for each failure in the failure universe and selecting
a limit midway between the expected “no fault” range of values and the nearest
failed value. These test limits were expanded, where necessary, to include
failed parameter value clusters in the non-detect region if test reliability
was improved by such action. An iterative process of selecting highly reliable
tests with regard to detection characteristics was used to build the fault
tree. Some test limits were adjusted in order to yield improved fault isolation
metrics.For example, there were four undetectable failure modes included
in the pass/fail zone for node 138. These failure modes were not detectable
by this test, regardless of the pass/fail limits. Therefore, a single pass/fail
limit was used to isolate the R44 Open failure mode from the other suspect
failure modes. If the test fails low, then R44 may be open. If the test
passes, then R44 is not open. The pass region for this fault isolation test
encompasses all of the expected no-fault range of values (2 X 4.75 sigma),
as well as a large portion of the fail range of voltages for the circuit.
This made it possible to use the fail outcome to isolate XOA8_C stuck at
minus 15, XOA8_B stuck at minus 15, R43 Open, R44 Open, XOA8_C Open, and
R36 Open from the other 25 failure modes which have an effect on that node. |
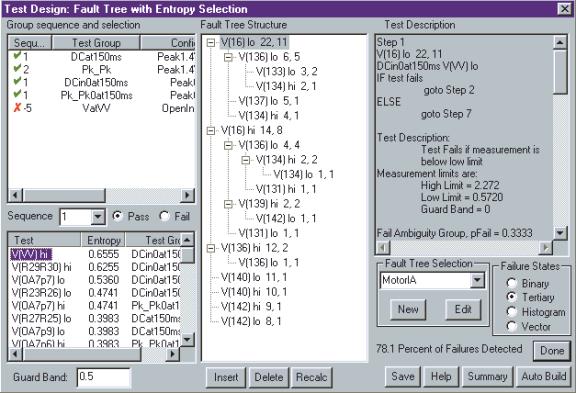
| Fault tree |
|
|
|
Figure
3 - Node 138 Voltages For Failure Modes and No Failure
|
| Many of the 850 components on the controller card have multiple
types of failure modes such as stuck at VCC, stuck at VEE, etc. As a result,
the Test Designer diagnostics isolated more than 1,100 failure modes. Test
Designer's model-based fault tree computation algorithm made it a simple
matter to identify the most robust circuit measurements, refine the test
limits to ensure reliability, and assemble the fault tree. At each branch
of the fault tree, the algorithm was invoked to suggest which test should
be next in the diagnostic sequence. The availability of reliable failure
isolation tests at each node made it an easy task to assemble the fault
tree. Test Designer kept track of the failure modes which had already been
detected and isolated, thereby eliminating what is typically a paperwork
headache. |
|
|
|
Figure
4 - Failure information shows limits can be expanded without affecting
test results.
|
| Sometimes
a situation arose in which a calculated measurement value was directly on
the pass/fail limit. Such a condition would yield unpredictable results,
so the engineer would typically rearrange the test sequence so that a prior
test would reliably isolate that fault and therefore remove it from the
fault universe. When such a change was made on an upper node of the fault
tree, the Test Designer program recalculated all of the isolations below
that node. By first simulating only the go-line tests while collecting the
no-fault and faulty circuit behavior characteristics at every node and globally
assigning coarse test measurement limits, the desired isolation metrics
were achieved by performing each go-line test in sequence and, upon failure
of a go-line test, probing the circuit without changing the applied stimuli.
Test Designer can generate the fault coverage statistics and call-out lists
at any point in this process, so the test engineer can easily assess whether
or not the fault coverage and isolation requirements are being met. |
|
|
|
Figure
5 - Binary test Pass/Fail limits set for specific fault detection characteristics.
|
| As the
fault tree was developed, the Test Designer displayed all pertinent detailed
test information. |
|
|
|
Figure
6 - Fault Tree example, created using the Test Designer program.
|
| Once the
fault tree was finalized, Test Designer was used to generate documentation
that defined the test sequence, again eliminating a tedious manual task.
The program can generate ATE pseudo-code in two formats: an ATLAS-like ASCII
text version, and C code. This pseudo-code was supplied to Pat Cupo, Senior
Systems Engineer for Instrumentation Engineering, who was responsible for
writing the software program that executes the fault tree. This program
provides the operator with explicit instructions concerning which test to
perform next, based upon the results of the previous test. Mr. Cupo said
that his company was pleasantly surprised to obtain such exhaustive diagnostic
routines under tight budget and delivery constraints. The project demonstrates
how the use of simulation-based synthesis makes it possible to complete
the entire diagnostics process – simulation, test design and fault tree
development -- in only 25% of the time required using manual methods. |